Need to Debug and Understand Code?
SourceDebug is a fast powerful project-oriented programming editor, code browser, and debugger that helps you understand code while you work and plan.
SourceDebug has built-in dynamic analysis for C/C++, Objective-C, and more.
SourceDebug can debug application with source code in different locations.

Key Benefits
- Help to understand an existing code base.
- Debug application with source code in different location (seperate source debug).
- Offline debug application for code analysis.
- Quickly navigate functions, variables, and more.
- Record the browsing location with comments and play back.
- Execute local cmd, remote cmd, and GDB cmd in embed comand window.
- Support GDB/GDB server or LLDB-MI debug over SSH, ADB, Telnet , Rlogin and Local Cygwin.
- See live definations to variables and other declarations with Syntax Formatting.
- Powerful editing features, including symbolic auto-completion, auto-highlight, smart search/replace.
- Online API manual and source control(git/svn/cvs).
It's perfect for getting up to speed and understanding a new code base.

Feature Highlights
SourceDebug was designed for large, demanding, real world programming projects. In fact, SourceDebug is being used today by important technology companies to develop some of the largest and most successful commercial hardware and software products.
Multiple Debug Mode
SourceDebug suports GDB or LLDB-MI debug over SSH, ADB, Telnet , Rlogin. It also supports Local Windows GDB such as Cygwin or GDB-multiarch. It can cooperate with GDB server to debug applications. It uses Quickwatch, Watches, Callstack, Variables, Memory, Breakpoint List, Disassemble and Thread List Dialogs to provide rich debugging informations. Sftp, Ftp and Network Drives are supported to access source code.

Seperate Source Debug
SourceDebug can debug application whose source code is placed anywhere. This key technology is called seperate source debug. If necessary, remote source files can be copied locally for easy access.
Below are some different possible cases:
Build server, source code server, target machine are the same local one.
Build server, source code server, target machine are the same remote one.
Build server and source code server are same, target machine is another one.
Target machine and source code server are same, build server is another one.
Build server, source code server, target machine are three diffent machines that may be accessible with SSH, Samba, ADB respectively.
Project-wide Keyword and File Searches
You can use the Find Symbols window to search keyword in your project. This lets you find sections of code with regular expression. For example, you might type “te*0” and SourceDebug will find all references to “test10”, “test100” and “test200” that occur near each other. You can also use it to find files by entering wildcards.

Data Structure Display
You can build the global symbol table by Build->Rebuild Project Symbols. After that, once any files are modified and saved, the symbol database will be updated automatically. You can get information of the data structure or class details with the ClassView window. All the global variables and functions can be found in the Globals section of the ClassView window.

Full Function Debug Tool Bar

With the debug tool bar, you can start/stop debug, step in, step over, step out the code. Set next statement, Run to current line.
Hexadecimal display,Quickwatch, Watches, Callstack, Variables, Memory, Breakpoints, Output, Disassembly views provide more details for debug infomation.
Easy Debug Configuration

SourceDebug suports GDB/GDB server or LLDB-MI debug over SSH, ADB, Telnet , Rlogin and Local Cygwin, which can be easily configured.
Use Custom Debug Mode to offlie debug for code analysis.
Quick Jump

The Jump To Definition button(F12) takes the symbol at the cursor position and jumps to its definition. If it's an include file then it will open that file. The Go Back(F11) and Go Forward(Ctrl + F11) buttons are useful for navigating back and forth between all your jumping spots.
Symbolic Auto-Completion

Auto completion shows you a list of potential identifier names. SourceDebug can show you function and variable names, as well as class and structure fields.
Embeded Linux Programmer's Manual
SourceDebug has the embeded latest Linux Programmer's Manual. In the code browsing process, press F1 on the keyword to start the man page window. It can display the manual document of the current keyword. You can also jump to other keywords you are interested in.

Contextual Syntax Formatting
Syntax Formatting is an important SourceDebug innovation that renders information in a dense, yet pleasing and useful way. It provides vastly improved display capabilities, including full rich text formatting. SourceDebug applies styles automatically based on lexical and symbolic information about your project. You can fully customize the style formatting.


Customizable Styles
You have control over Syntax Formatting styles, which are automatically applied to source code elements based on parsing and scoping rules. You can set formatting options for many types of syntax elements and identifiers. You can drammatically change the look of your source code.
Smart Bookmark
Smart Bookmark helps to record code browsing trace. You can add one mark at anytime when you’re browsing code. Then you can reach the designated location by pressing the button of First Location, Previous Location, Current Location, Next Location or Last Location. You can edit the location record file by pressing "Open Location File" button, add comments to the lines or adjust lines positions. Then you can go to the special line by clicking the “Define Start Location” button. You can record the function calls in this way and then share the location file to others.

Smart Find Box
You can use Ctrl + d to focus on the Find Text Box.
You can input text in the Find Box and press Enter key and SourceDebug can automatically locate the line contains the text.
If your input is a number and followed by a Ctrl + g SourceDebug can automatically goto that line.
Directly Find Text:
Directly Goto Line:
Automatic Reference Highlighting

SourceDebug can highlight references to the symbol at the cursor position. For example, you can click in a variable name, and all references to the variable will be highlighted. This works for variables, class members, functions, and so on.
Collapsible Code Blocks

Code blocks and regions can be collapsed and expanded to help you navigate and understand complex functions.
Source Control
If the source code is managed by a version control system, some operations of version control can be performed as shown in the figure. Git, svn, cvs are currently supported and can be set through Tools->Options->Source Control. You can check the status of the files in each directory through View->Views->Source Repository.

Multiple Layouts
Save multiple window layouts, and switch quickly between them.

Command Window
The command window can be launched by clicking the command button on the left. Here, you can execute local windows commands, remote commands, and gdb debugging commands.

Remote File Explorer

Remote Files window is a small remote file explorer that shows the remote file. Currently Ftp, Sftp, Network drive are support to access remote file.
Local File Manager

The File Manager can be opened by View->Views->File Manager. Double click the item to open it. Right-click on the item to display the same context menu as the standard explorer.
External Tools

You can add external tools through Tools->External Tools. Local, remote or debug tools can be added.
Code Snippets

Code Snippets are small chunks of commonly used source code that you can insert into your source files. For example, typing fori followed by the Tab key will insert a predefined for text block.
Hex View

You can use Edit->Hex View (Ctrl + h) to open current file in Hex View mode. If it's a local file you can also edit the file in Hex View mode.
Quick Watch

The Quick Watch window can display detailed information about complex data structures and change with the debug process.
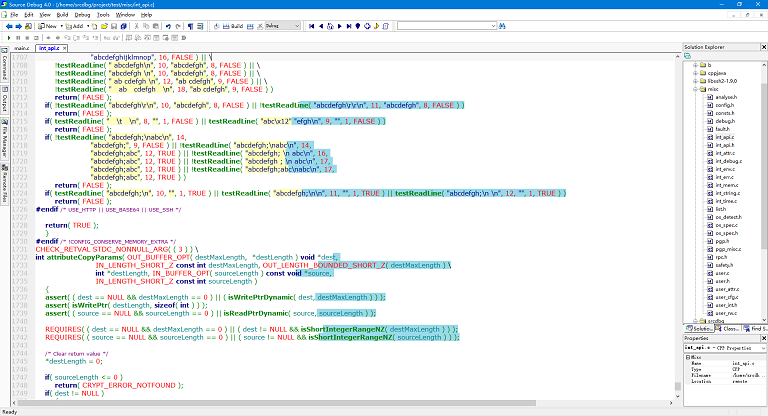
Code Overlength Coloring
When the code is too long, SourceDebug can color the overlengthed code. You can configure the overlength width and enable/disable the code overlength coloring function through Tools->Options->Text Editors. You can also toggle showing this function through Edit->Advanced->View Overlength Coloring.
Designed for Large Projects
SourceDebug can handle projects with millions of lines of code and millions of declared symbols.
System Requirements:
• Windows 10/8/7/Vista and later versions.
• Windows Server 2008, 2012
Documents:
| Getting started | |
| User Interface |
SourceDebug provides rich howto cases to help you develop complex projects quickly.
Ready to try it for yourself? Get started today!
Try SourceDebug on your project for free and see what a difference it makes in your productivity. The Trial version runs for 20 days and is almost fully functional, except that each project allows a maximum of 100 files.