| Menu Command | Description |
|---|---|
| Start without Debugging | Run the application on the remote machine. Output is viewed in the console output window. |
| Start Debugging | Start the debugger. |
| Stop Debugging | Stop the debugger. |
| Restart Debugging | Stop and start the debugger. |
| Break | Halt the debugger. Use this menu when the debugger is running and you need to examine variables, call stack, etc. |
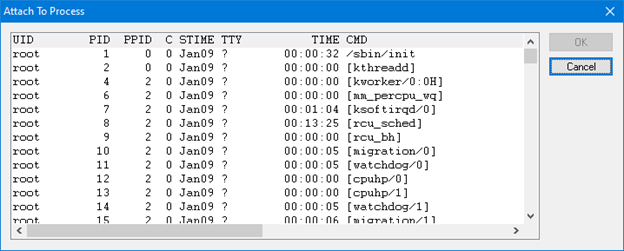
| Attach to Process | Display a list of running modules. Attach to a running process. See More... |
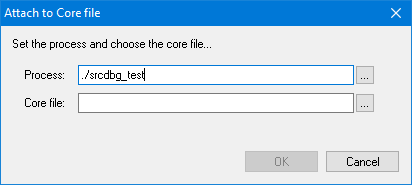
| Attach to Core file | Choose a process and a core file. Attach to the core file. See More... |
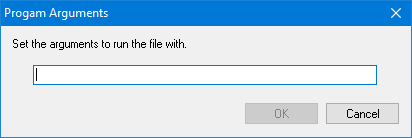
| Set Program Arguments | Set the launch arguments for the executable. See More... |
| Step Into | Step into the next statement. |
| Step Over | Step over of the current method. |
| Step Out | Step out of the current method. |
| Run to Cursor | Execute the application until the instruction at the cursor is reached. |
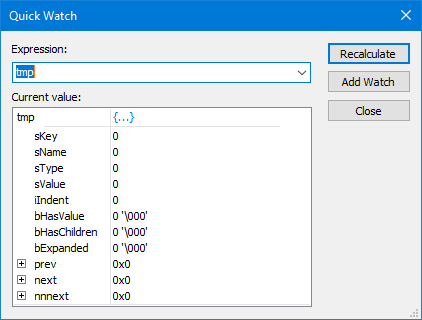
| Quick Watch | Quick watch selected symbol in current document. See More... |
| New Breakpoint | Set a new breakpoint at the cursor location. |
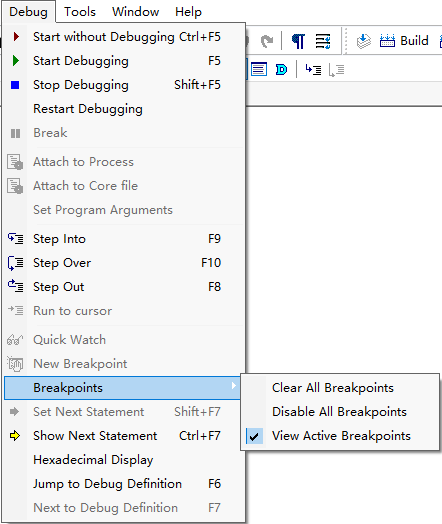
| Breakpoints | Clear All Breakpoints | Clear all breakpoints. |
| Breakpoints | Disable All Breakpoints | Disable all breakpoints. |
| Breakpoints | View active breakpoints | View information about breakpoints activated in the debugger. |
| Set Next Statement | Set the line of code that the debugger will run next. |
| Show Next Statement | Show the line of code currently running in the debugger. |
| Hexadecimal Display | Toggle the display mode(Hex or Decimal) of the debugger to show the value of variables. |
| Jump to Debug Definition | Jump to the source location of the symbol in the debug symbol table. |
| Next to Debug Definition | Jump to the next source location of the symbol in the debug symbol table. |
Attach to Process:
Attach to Core file:
Set Program Arguments:
Quick Watch: This dialog is an interface for evaluating keyboard-entered expressions and viewing the result of the evaluation within a data display tree. Expressions are evaluated in the context of the current debug stack frame, so this feature is available only when a debug session is active and the debug program has been paused or has stopped at a breakpoint or exception.